TL;DR
I built a zero-cost, fully customizable stock market scanner tailored for swing traders using free data and Python. It filters thousands of tickers daily, calculates multiple technical indicators, applies flexible trading strategies, and generates clear charts and sector analysis—all automated to save time and improve trade quality.
While optimized for daily data and swing trading, it can be adapted for intraday or algorithmic trading with higher-frequency data sources.
If you want full control over your scanning process and a tool that evolves with your trading style, this guide and accompanying scripts will help you build your own powerful scanner from scratch.
Introduction
If you trade regularly, you probably know the feeling: You sit down in the morning, open your screener, and… you’re staring at hundreds of tickers.
Half of them aren’t even in your trading range. A quarter are penny stocks you’d never touch. And the rest? You have to dig through charts one by one, hoping to spot a decent setup before the market opens.
It’s exhausting and, worse, it’s inconsistent.
I wanted a better way.

Why I Built My Own Scanner
When I first started looking for market screeners, I thought I’d be spoiled for choice. There are hundreds out there—some free, some pricey, some sleek, some painfully clunky. But after trying more than a few, I realized they all shared the same flaw:
They were built for someone else’s trading style, not mine.
As a swing trader, my setups change with the market. Some weeks I’m hunting for sharp reversals. Other times I’m riding a trend until it runs out of steam. I’m not married to one indicator or formula—I adapt. But most screeners felt rigid, locking me into predefined filters or forcing me to bend my process to fit their limitations.
That’s why I built my own.
Not just a single-strategy screener, but a flexible framework. I designed it to handle five completely different strategies, from momentum plays to mean reversion, using various combinations of indicators—RSI, MACD, ATR, moving averages, volatility filters—not as “the” way to trade, but as examples of what’s possible.
The idea was simple: give traders a starting point, but also the freedom to tweak, replace, and combine indicators until it feels like their own tool.
With my scanner, I get:
-
Total control over every calculation
-
Daily automation that runs without me lifting a finger
-
Clear visual context—charts, sector stats, and performance summaries—at a glance
It’s not just a scanner. It’s a customizable engine you can make entirely your own—and if you want, it can plug straight into an algorithmic trading setup.
A note on data and trading styles: Since this scanner uses free data providers that typically deliver daily price data, it’s primarily optimized for swing trading—holding positions over days or weeks. That said, the system’s flexible design means you can easily extend it for intraday trading or plug it into algorithmic trading setups if you switch to data sources that support higher-frequency updates.
The Core Idea
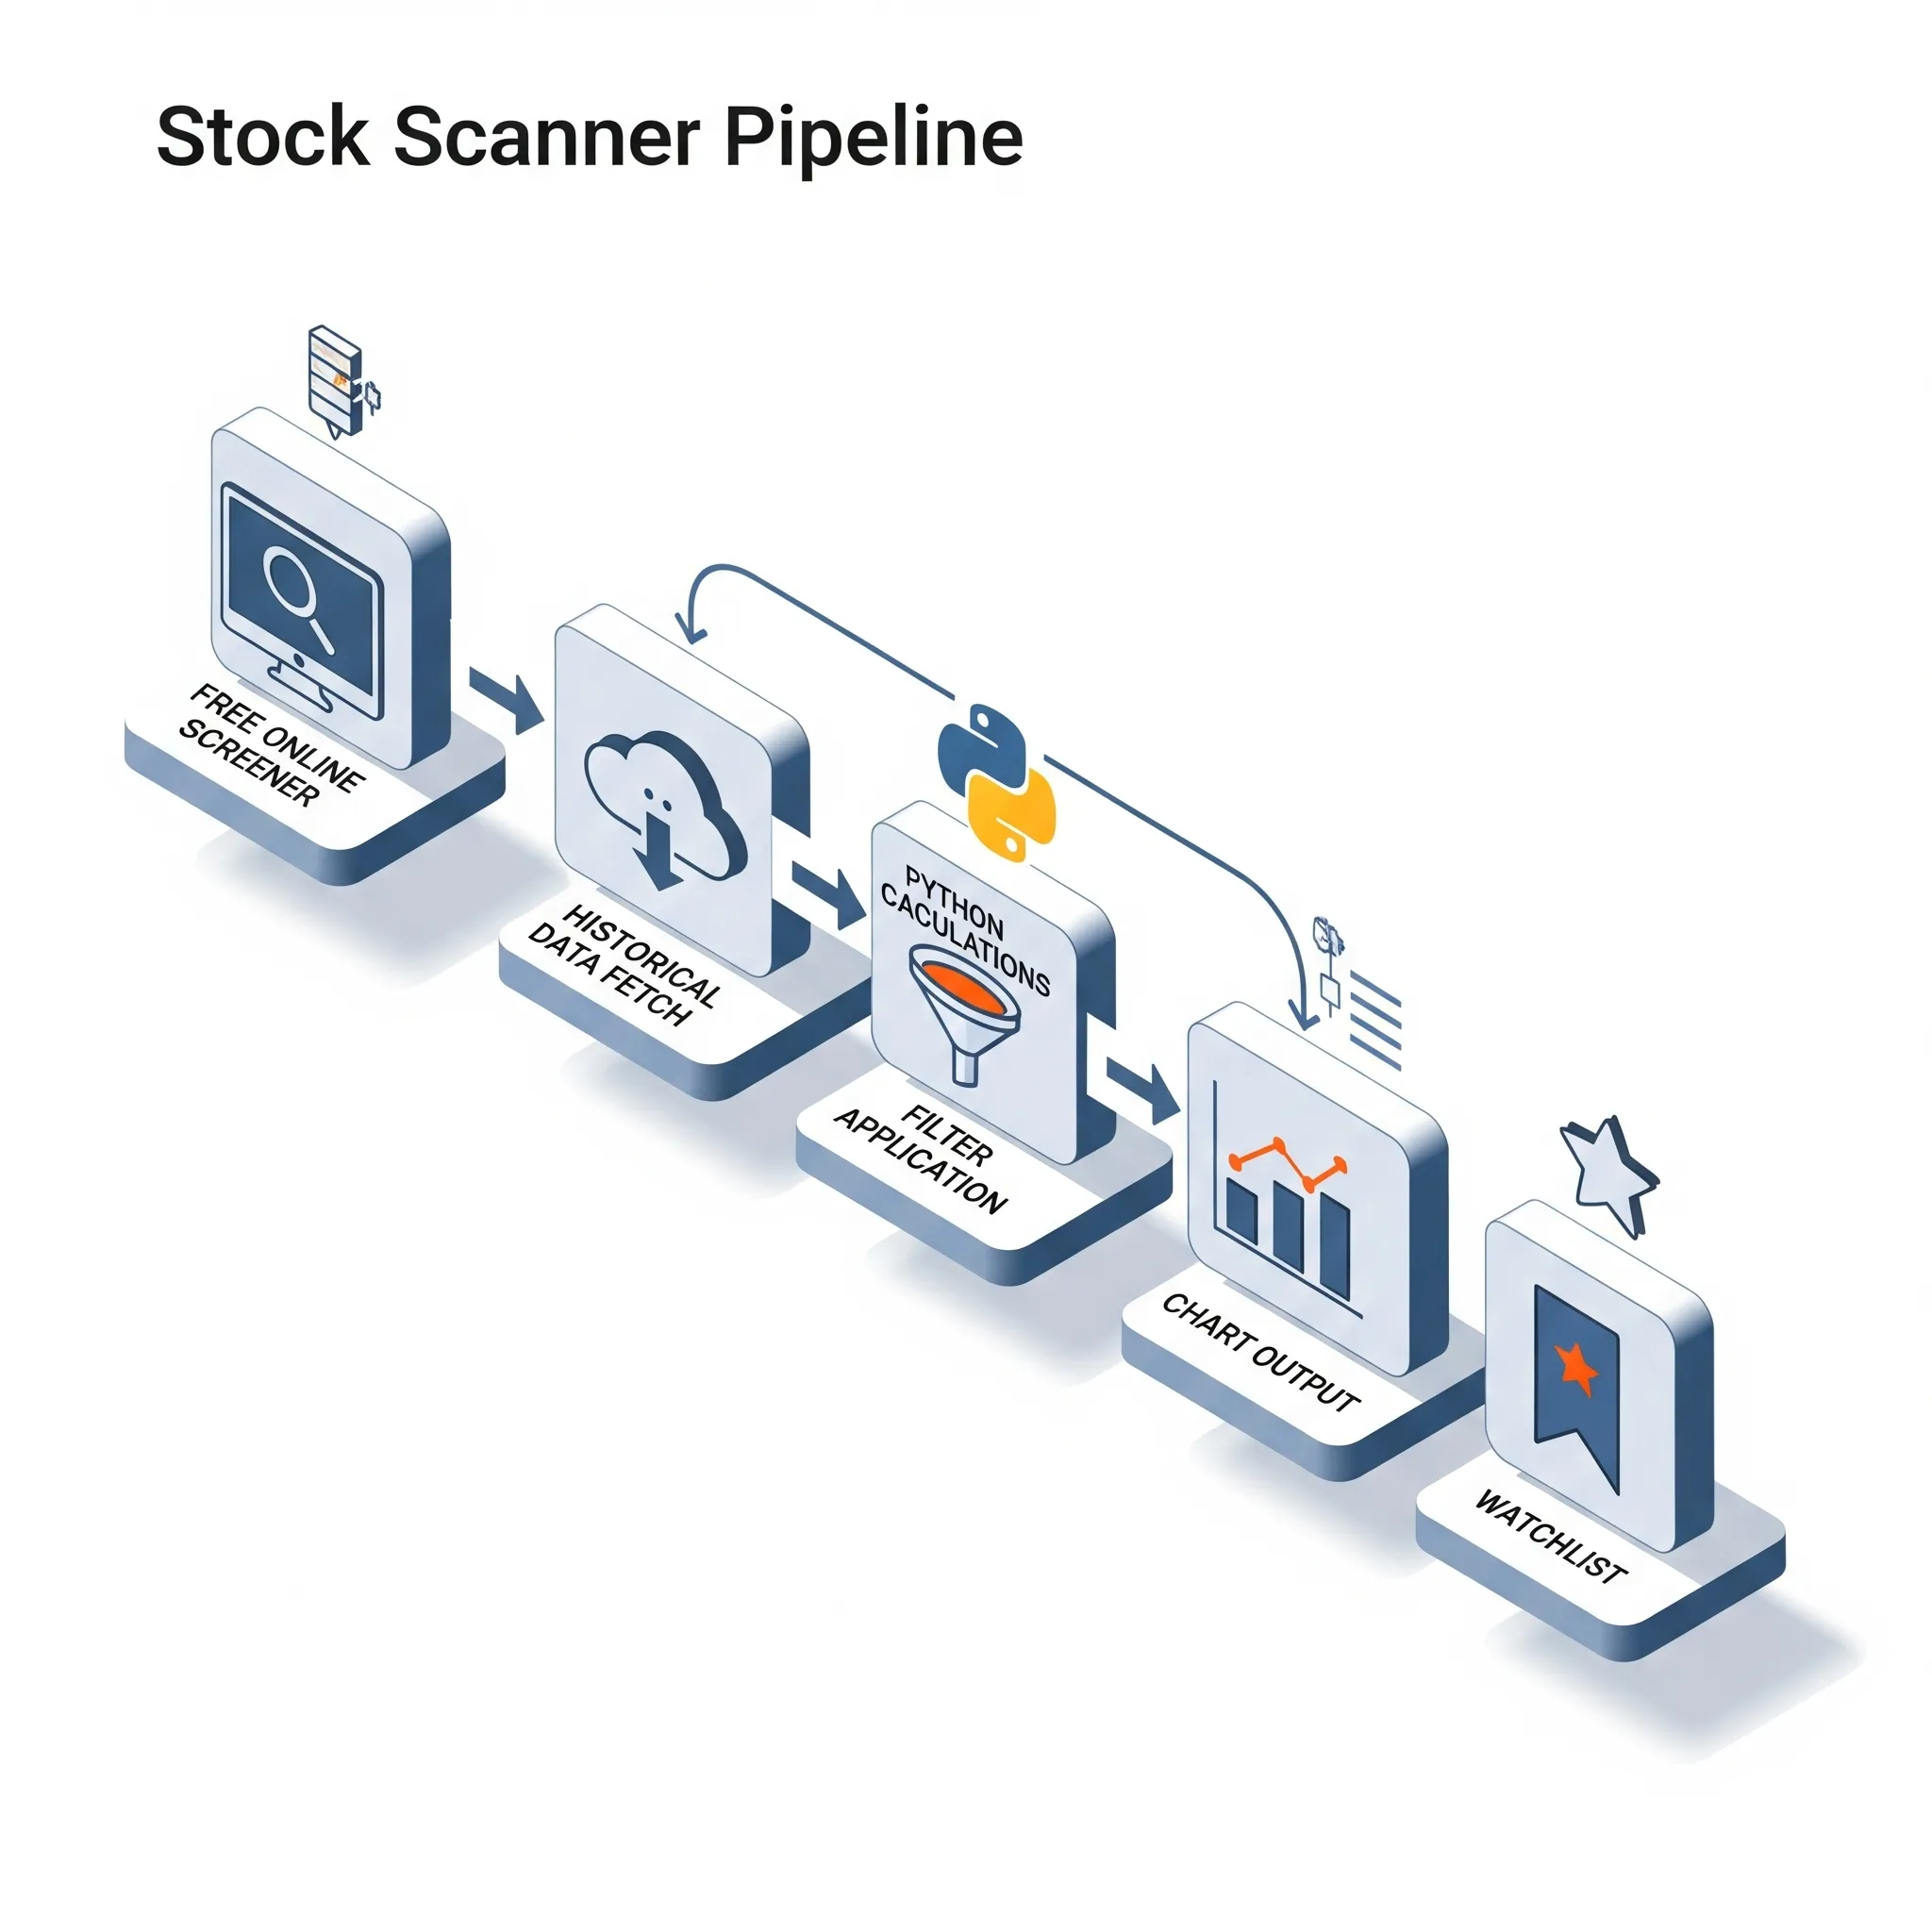
The concept was straightforward:
-
Use a free online screener to filter out obvious junk tickers before doing any heavy lifting.
-
Pull historical data only for that smaller, cleaner list.
-
Run technical indicator calculations in Python.
-
Apply precisely defined criteria—a mix of indicators and rules—to produce a focused, postfiltered list.
-
Generate charts and sector analysis to visually confirm opportunities.
-
Maintain self-updating watchlists with tickers that already match your setup or are close to triggering it.
-
Best of all: it runs automatically.
The result? Each morning I open a results file with 5–10 high-quality candidates—no hours wasted sifting through noise.
Step 1: Pre-Scanning
The process starts with an automated scan using a fast, web-based screener. My script runs this scan instantly, applying a set of beginner-friendly filters that I explain in plain language.
The initial setup looks for:
-
Well-established, highly liquid stocks
-
Markets with dependable, consistent data
-
Individual companies rather than funds or ETFs
-
Healthy daily trading activity for smooth entries and exits
-
Prices comfortably above penny-stock territory
-
Manageable short interest for reduced volatility shocks
-
Noticeable daily price movement
-
A strong, long-term upward trend
This automated step trims thousands of tickers to a focused ticker list in seconds. While my default “recipe” is tuned for new traders, every parameter can be easily adjusted to fit your own goals, style, and risk tolerance.
Step 2: Fetching and Storing Data
Once I scrape those tickers, I pull historical data using a free API I've been using for years—two years of daily prices for each symbol.
I save each ticker as a Feather file, which is a super-lightweight, high-speed data format. Why Feather? Because it loads 10x faster than CSV and keeps storage tidy.
Step 3: Indicator Calculations
Here’s where Python does the heavy lifting. My script:
-
Loads all Feather files
-
Calculates indicators like RSI, MACD, ATR, Moving Averages, and more
-
Creates two summaries:
-
Sector-level (overview of the whole market)
-
Stock-level (per-ticker stats)
-
Step 4: Applying My Filters
Here’s where the real power of this system shines: the strategies themselves. The scanner’s modular design makes it easy to implement, test, and adjust different buy and sell logics without rewriting the entire system.
These strategies are examples, not recommendations. The real value lies in how the scanner’s architecture lets you easily modify parameters, swap indicators, and combine filters to fit your unique style and evolving market conditions.
Some of my exemplary built-in strategies however include:
RSI + MACD Combination — Oversold pullbacks in uptrends
RSI recovering above 30 plus a bullish MACD crossover, with ATR filtering for volatility. Ideal when markets trend up but stocks pull back into value zones.
EMA 8/21 Crossover — Clean, sustained uptrends
Short EMA crossing above a long EMA signals trend continuation. Works best in trending markets; prone to whipsaws in sideways conditions.
Bollinger Band Breakout — High-volatility breakouts
Buy on closes above the upper band, sell below the lower. ATR thresholds filter out low-volatility false moves.
ADX + RSI Trend Confirmation — Strong-trend continuation
Triggers only when ADX shows a strong trend and RSI confirms momentum, avoiding signals in choppy markets.
Stochastic Reversal — Range-bound swings
%K crossing %D in oversold or overbought zones. Effective in sideways markets; benefits from trend or volume filters.
Step 5: Visualization

Before placing trades, the system generates sector distribution charts to show whether setups are clustering in specific industries. This gives you a quick, high-level market overview — helping you spot sector-wide strength or weakness, track potential rotation between industries, and avoid overexposure to one area.
However, keep in mind that this chart reflects only the tickers that have already passed your first prefiltering step. The more aggressively you filter at that stage, the more “watered down” or incomplete the sector picture becomes. It’s still useful, but you should interpret it in the context of the narrowed universe you’re working with.
The system also plots 3-month price charts for each candidate stock, providing a fast visual read on recent price action and technical context.
Both chart types are highly modifiable — you can adjust timeframes, styles, and display options to match your own preferences. I’ve deliberately overloaded the sample charts with extra elements to demonstrate their flexibility. If you prefer a cleaner look, it’s as simple as deleting or commenting out a few lines of code.
For traders working with higher-frequency data or intraday strategies, these plots can also be dynamically updated in real time, providing up-to-the-minute visual feedback tailored to faster trading styles.
This visual confirmation step not only filters out mechanical “trap” trades but also strengthens your intuition about when a signal truly matters in the broader market context.
The Result
Instead of spending hours sifting through noise, my scanner hands me:
-
A daily watchlists tailored to my trading style
-
Charts and sector stats for instant context
-
The ability to tweak rules anytime without reengineering the whole system
And the best part? It costs me nothing to run.
Want to Build Your Own?
I’ve bundled everything you need into one package — the complete ebook, fully functional Python scripts, and detailed customization notes — so you can build this scanner yourself without starting from zero.
You can grab the comprehensive guide and market scanner here: Zero-Cost, Flexible Python Stock Market Scanner — Build, Customize, and Automate Your Trading Edge
On that page, you’ll find a Gumroad link to take you straight to the secure sales page.
Want to see it in action first? Watch this quick demonstration video showing how the post-scan strategy process works.
If this scanner helps you capture even a single profitable trade, it will have more than paid for itself.
Final Thoughts
Markets move fast, and opportunities rarely wait for traders still sifting through noise. The edge comes from being prepared before the open — knowing exactly which stocks deserve your attention and why.
That’s what this scanner is built for: putting a curated, data-driven watchlist in your hands every morning, tailored to your style, and ready for action.
If you’re tired of wasting time on irrelevant tickers and you want a tool that adapts with you, now’s the time to build your own. You don’t need to reinvent the wheel — the framework is here, tested, and ready.
Get the complete scanner package now, and start every trading day ahead of the game.